

Lukasz Zelezny: Kolika je važnost Pearsonovog koeficijenta korelacije u ‘inbound’ marketingu?
 Martina Vuksan
02. 12. 2013.
Martina Vuksan
02. 12. 2013.
Kao neizbježni dio online marketinga, SEO je predstavljao veliku važnost na nedavno održanom Marketing Festivalu u Brnu. Jedno od najboljih predavanja posvećenog optimizaciji za tražilice, odnosno, SEO-u, prema ocjeni posjetitelja, bilo je vezano za učinkoviti web promet i Pearsonov koeficijent korelacije u inbound marketingu, kojega je održao Lukasz Zelezny, voditelj inbound marketinga u Uswitch.com.

Kao neizbježni dio online marketinga, SEO je predstavljao veliku važnost na nedavno održanom Marketing Festivalu u Brnu. Jedno od najboljih predavanja posvećenog optimizaciji za tražilice, odnosno, SEO-u, prema ocjeni posjetitelja, bilo je vezano za učinkoviti web promet i Pearsonov koeficijent korelacije u inbound marketingu.
Lukasz Zelezny, voditelj inbound marketinga u Uswitch.com započeo je svoju zanimljivu prezentaciju naglašavajući važnost određivanja Pearsonovog koeficijenta prema dobro pozicioniranim ključnim riječima na Googleu.
Naglasak je bio na nerazdvojenost dviju ključnih komponenta: kako ključne riječi rangiraju i kako dovode promet na vaš web.
Koje ključne riječi uzeti u obzir?
Kao dva neizbježna pravila pri odluci o korištenju ključnih riječi, Lukasz je spomenuo korištenje decent search volumea i praćenje fluktuacije ključnih riječi na tjednoj bazi.
Decent search volumeom Lukasz smatra sve one ključne riječi kojima se pretraga penje na više od 1000 (idealno bi bilo nekoliko tisuća). Tijekom testiranja, primjećuje se stabilna fluktuacija riječi, a kao neke primjere Lukasz je naveo “kreditne kartice”, “auto osiguranja” ili, recimo, “odmor u Hrvatskoj”.
Najbolji dan za mjerenje ključnih riječi je ponedjeljak iz razloga što je promet tada najveći. Najgore dane predstavlja viked jer su ljudi uglavnom izvan kuće i ureda. Savjetujem da odvojite minimalno dva sata svakog ponedjeljka te da se usredotočite na ključne riječi. Na taj ćete način lako znati što trebate učiniti i na što usmjeriti svoje Google poslovanje u budućnosti.

Rangiranje i web promet
Lukasz je na konferenciji pokazao ono što najčešće radi, a to je računanje u svojoj Excel tablici. Pomoću njih otkrio je neke nevjerojatne rezultate. Shvatio je da web promet pada kako se rangiranje podiže.
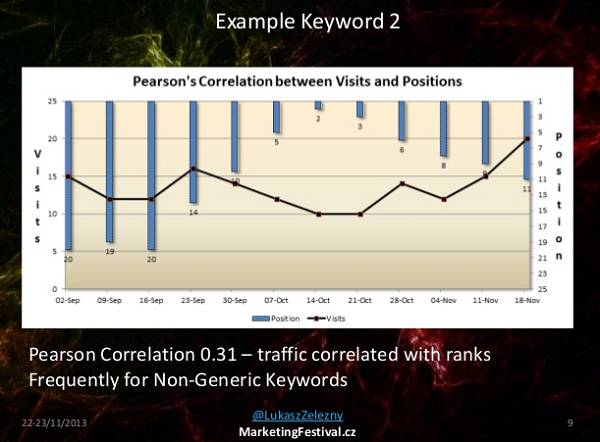
Prema njegovim savjetima, najbolje je usredotočiti se se na tri stvari ako ste dio SEO svijeta:
- Dnevno mjerenje specifičnih ključnih riječi (SERP)
- Dnevni posjeti generirani prema specifičnoj riječi
- Bolja kvaliteta ključnih riječi
Pearsonov koeficijent korelacije između pozicioniranja i web prometa omogućava najbolje mid-tail keywords (ključne riječi srednje dužine) mogućnosti. Također, isti vas izdvaja iz konkurencije te poboljšava učinkovitost web prometa, napomenuo je Lukasz.
Mjerenje učinkovitosti web posjeta
Za razliku od rangiranja i web prometa, učinkovitost posjeta mjeri se na godišnjoj razini. Razlog tome je različito ponašanje korisnika tijekom sezona.
Ovdje je najvažnije je držati se odabranih dana i pobrinuti se da se dani poklapaju. Ako započnete tjedan mjerenja u nedjelju, tada se nedjelje uvijek morate držati. Isto je i s drugim danima koje odaberete.
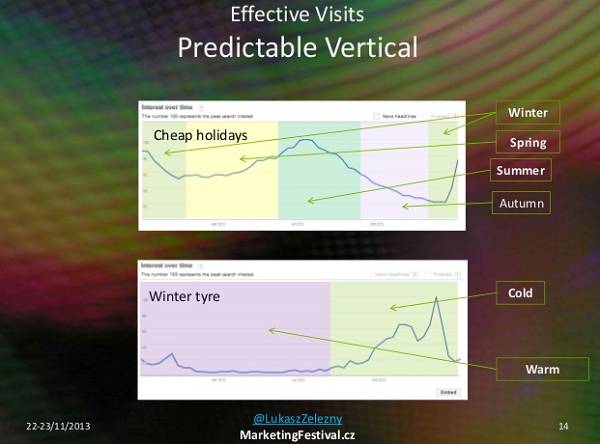
Mjerenje odabranog tjedna, odnosno mjeseca prema istom tjednu/mjesecu prethodne godine te također verifikacija broja posjetitelja nakon isključivanja posjetitelja koji su odmah napustili stranicu, predstavlja učinkovitost web posjeta (poznato kao non-bounced posjeti). Lukasz tvrdi da je to vrlo točan pokazatelj povećanog ili smanjenog posjeta na vašoj stranici.
Cijelu prezentaciju možete pogledati ovdje. Također vam donosimo i neke od zanimljivih tvitova objavljenih odmah nakon Lukaszove prezentacije u Brnu, koji vam mogu dočarati zadovoljstvo posjetitelja viđenim.
From my point of view @LukaszZelezny has best SEO presentation on #mktfest
— Pavel Ungr (@PavelUngr) November 23, 2013
Good point from @LukaszZelezny at #mktfest effective visits are the first steps to conversions
— Bart Berlinski (@berlinski) November 23, 2013
Too bad @LukaszZelezny didn’t have workshop at #mktfest, many of us would appreciate it 🙂
— Matus Pavliscak (@pavliscak) November 23, 2013








Sukladno članku 94. Zakona o elektroničkim medijima, komentiranje članaka na Netokraciji dopušteno je samo korisnicima koji ostave svoje ime i prezime te mail adresu i prihvate pravila ponašanja.
Pravila ponašanja
Na Netokraciji za vas stvaramo kvalitetan, autorski potpisan sadržaj i zaista se veselimo vašim kvalitetnim, kontruktivnim komentarima. Poštujmo stoga jedni druge prilikom komentiranja, kao i Zakon, držeći se sljedećih pravila ponašanja:
Kako koristimo podatke koje ostavljate? Bacite oko na našu izjavu o privatnosti.
Sve ostale komentare ćemo s guštom spaliti, jer ne zaslužuju svoje mjesto na internetu.
Komentari
Nedim
02. 12. 2013. u 10:42 pm
Zanimljiv članak, ali ja ovdje mogu postaviti tri pitanja na koja se nije odgovorilo:
1. Koliko je ovo provodivo u praksi? Samo prisjetite “Not provided” u GA i na činjenicu da sada nemamo 100% precizne podatke o broju posjeta za određene ključne riječi.
2. Google danas teži personaliziranim rezultatima i ako sam ja za ključnu riječ XYZ rangiran na X mjestu, ne znači da je osobi Y moja stranica isto rangirana. Tako da se postavlja pitanje prikupljanja podataka..
Zanimljiva studija o tome:
http://moz.com/blog/comparing-ranktracking-methods-browser-vs-crawler-vs-webmaster-tools
3. Upotreba Pearsonovog koeficijenta korelacije. Naime:
Pearsonov koeficijent korelacije koristi se u slučajevima kada između varijabli promatranog modela postoji linearna povezanost i neprekidna normalna distribucija.
Kod odnosa pozicije i klikova mislim da nije prisutan linearni trend, već eksponencijalni, kao i da nema normalan raspored/distribuciju.
Zanimljiv tekst o ovome:
“Both Spearman and Pearson are trying to find whether two variables correlate through a monotone function, the difference is that they treat different type of variables – Pearson deals with non-ranked or continuous variables while Spearman deals with ranked data.”
http://moz.com/blog/the-science-of-ranking-correlations
Lukasz Zelezny
03. 12. 2013. u 7:02 pm
1. First of all thank you very for your questions! Because of not provided, I mentioned in my presentation that you must use Bing data and
expand (“stretch pattern”). Bing UK frequently deliver 10% of what Google
does. Lets say If you have 20 visits from Bing (non-paid) on position 2nd for a
selected keywords daily, you can take an assumption that you should have
around 200 visits from Google on the same keyword on the same position.
Adwords PPC data is also useful as long as you don’t use keyword insertion.
2. Great question! Let me answer this way.
Long time ago someone told – “Alexa is better than guesswork”.
And you can still get lots of interesting conclusions using Alexa.com
Using described above correlation you can acurately measure trend and
arrange acurate conclusions as well as priotitize keywords, and more…
Theory is theory, practice is practice. From our experience these
differences aren’t massive especially for mid-tail keywords around UK.
No matter you are in Glasgow, London or Manchester.
And what about business dealing on local market.
These will either check their rank using same localization.
3. We done tests with both Spearman’s and Pearson’s methods.
Here is what we end up with:
Spearman’s Correlation was less sensitive for glitches / huge random
spikes in data. What can “destroy” your results when you use Pearson’s
seems to be non-vulnerable for Spearmans.
Both method we used, presented almost the same results. However there is
significant differences in time you need to spend on to get results ready
using Spearman’s correlation.
Problem is that there is no build-in Spearman’s Correltion function in
Excel. You need to use commerical plugin / extension or go manually –
which is really time consuming.
So we agree with you that Spearman’s would be better. But because Pearon’s
is gives almost same results and is way easier to implement – we end up
with Pearson’s.
Hope that answers you questions 🙂
Nedim
04. 12. 2013. u 12:05 am
@Lukasz Zelezny
Thank you for answering my questions. I am honored because of that.
I agree with everything and I just wonder if there is a way to get SERP automatically to measure correlation. It is useful because of trying to guess factors. Something like this:
http://moz.com/search-ranking-factors/methodology
It would be really hard to do manually – sample should be huge.
Thanks 🙂
Lukasz Zelezny
05. 12. 2013. u 11:49 am
@Nedim thank you very much. Answering you question – according to automatic processing data, as far as I know there are two SEO platform that their owners were interested to implement this processing. I am in touch with both companies and I should know more soon.
Thanks : )
Chande
04. 12. 2013. u 11:40 pm
Hi Lukas,
Couple of insights into your excellent presentation:
1) Not provided – you can still get visits data from GWC and compare it to landing pages and usage on landing pages – that way you can improve those pages
2) Saying that bounced visit is something that correlates with conversions is really not true – example: if I am researching on a topic, I came to the page and found the answer, bookmarked and came back after one month (even for a booking) – that is not tracked with Google Analytics – either use KissMetrics, Mixpanel or Trak.io to get that data or correlate that data with specific Analytics tag where you can monitor the visits above the regular duration – see Yehoshua Corens’ great post about how we don’t understand “bounce” – http://www.analytics-ninja.com/blog/2012/06/google-analytics-bounce-rate-demystified.html
3) Your model still does not include cross-device analysis – example: I search on mobile, research on desktop, and when I am at home, I book the hotel with my gf/wife/whatever – so, making such correlations is good, but not 100% accurate (p.s. worked in travel, rainy day in Munich means more bookings 🙂
Otherwise, very good!
Thanks
p.s. even those analytics tools (KM, MP, Trak) cannot get cross-device tracking (yet) 🙂
Lukasz Zelezny
05. 12. 2013. u 12:28 pm
@Chande
Thanks for your feedback. I will try to give a little comment to your suggestions.
1. Are you referring to GWT? If you do, I can only say it is a good method too. A different one but still good. You know, online marketing is like martial arts – everyone has own Kung Fu, Judo, Karate – the most important is where we end up : )
2. Good point Sir and thank you for sharing article.
I would even go a little deeper and expand your example.
Popular blogs with thousands of visits or websites similar to Yahoo! Answers, these websites has high bouncerate which doesn’t necessarily mean they are irrelevant. People, who are visiting page from search engine, are reading article that answers what they were looking for and then going somewhere else. There is no conversion funnel but you can still have a goal which may be a Time on Site.
Also, You mention a very specific example.
That’s very true however if you have few million visitors monthly, you need to keep focus on these 95% of them who belongs to standard-behaviour users group. These 5% that left (which would include your example) I would call a non-standard behaviour users. It is a great idea to use KissMetrics or other mentioned tools as longs as it has significant impact on business.
Does it really change profitability of the company if I know that one or two users are adding daily your website to bookmarks and then returns after a month? I doubt. Apart from that, cost of tracking may be significant. Finally you may end up in a situation where tracking of traffic is so expensive that instead of improves your business it makes you company less profitable.
As a conclusion I can only say that as much as I agree with you I am also trying to keep this (what I call) “healthy balance” 🙂 Theory is theory, and it would be great to track everything and everywhere getting 100% accurate data. But it is just a theory.
Simple example: If you use 3 analytics tools simultaneously on the same website: GA, Omniture, Piwik – data will never match. Visits are always a bit different as well as other metrics. This is because of cookies, how each tool is build up, how each tool interprete data and more… I still don’t see that as a problem.
3. A bit like above. I wish there would be a tool giving you answers for all your questions and be able to track everyone and everywhere. But as long as my method give us a picture how does situation looks like and what is the trend – you may be able to conclude which keywords would be worthy to work on.
And this is it. This is what is the online marketing world we living in like today 🙂
Hope these comments give you a bit of my personal approach to online marketing,
Cheers,
Chande
05. 12. 2013. u 12:46 pm
Hi Lukas,
Great answers and I must say that you are 100% right on the cost of tracking. My experiences with sites with millions of visits is to do a high-level dashboard of most important microconversions that stack up to other efforts. In that sense, I use analytics more to track and get insights into user behavior than just SEO or PPC. Improving UX, conversion techniques and landing pages significantly impact the bottom line – and having great analytics dashboard and KPIs can help a lot (I love custom segments from Avinash and some dashboards at http://www.dashboardjunkie.com are true gems and save a lot of time configuring GA).
Cheers